Note
Go to the end to download the full example code
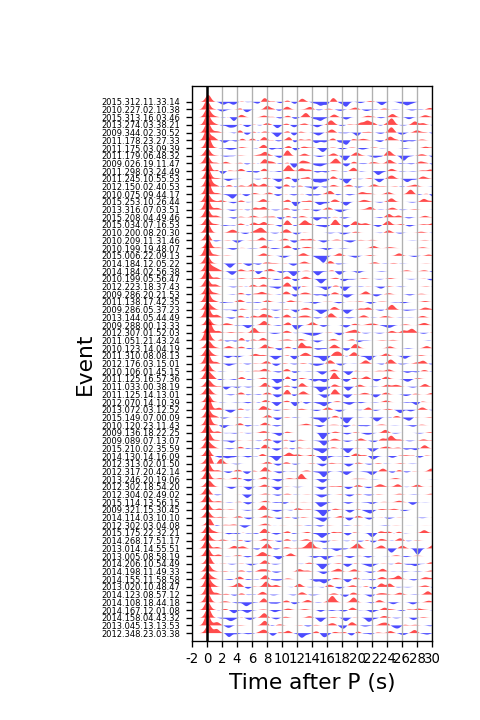
Receiver Functions order by back-azimuth#

import numpy as np
from seispy.rfcorrect import RFStation
import matplotlib.pyplot as plt


def plot(enf=3, xlim=(-2, 30)):
    rfsta = RFStation('./exrfs')
    fig = plt.figure(figsize=(4, 6), dpi=120)
    ax = fig.add_subplot()
    fig.subplots_adjust(left=0.4)
    ax.grid(axis='x')
    bound = np.zeros(rfsta.rflength)
    for i in range(rfsta.ev_num):
        datar = rfsta.datar[i] * enf + (i + 1)
        ax.fill_between(rfsta.time_axis, datar, bound + i+1, where=datar > i+1, facecolor='red',
                         alpha=0.7)
        ax.fill_between(rfsta.time_axis, datar, bound + i+1, where=datar < i+1, facecolor='blue',
                         alpha=0.7)
    ax.axvline(0, *ax.get_ylim(), color='black')
    x_range = np.arange(xlim[0], xlim[1]+2, 2)
    y_range = np.arange(rfsta.ev_num) + 1
    ax.set_xlim(xlim)
    ax.set_xticks(x_range)
    ax.set_xticklabels(x_range, fontsize=8)
    ax.set_ylim(0, rfsta.ev_num + 2)
    ax.set_yticks(y_range)
    ax.set_yticklabels(rfsta.event, fontsize=5)
    ax.set_xlabel('Time after P (s)', fontsize=13)
    ax.set_ylabel('Event', fontsize=13)
    fig.show()


if __name__ == '__main__':
    plot()
Total running time of the script: (0 minutes 1.199 seconds)