Note
Go to the end to download the full example code.
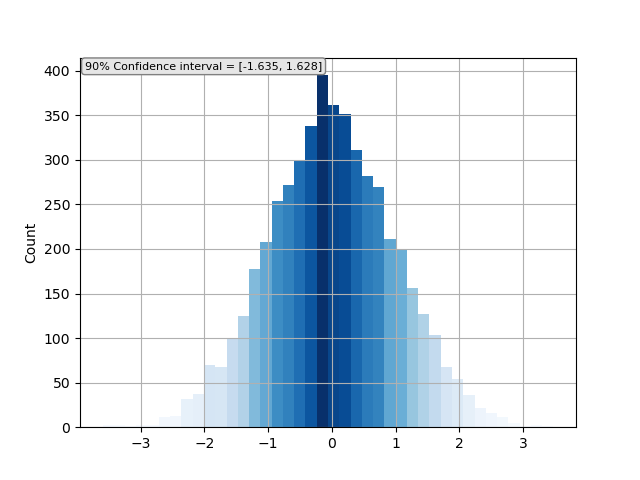
Colored histogram
This is en example of histogram with colored bars.
import numpy as np
import matplotlib.pyplot as plt
from scipy import stats
from matplotlib import colors


def plot(nsamp=5000):
    rng = np.random.default_rng(19680801)
    dist = rng.standard_normal(nsamp)
    fig, ax = plt.subplots()
    ax.grid()
    N, bins, patches = ax.hist(dist, bins=40)
    fracs = N / N.max()
    norm = colors.Normalize(fracs.min(), fracs.max())
    for thisfrac, thispatch in zip(fracs, patches):
        color = plt.cm.Blues(norm(thisfrac))
        thispatch.set_facecolor(color)
    mean = np.mean(dist)
    std = np.std(dist)
    ci = stats.norm.interval(0.90, loc=mean, scale=std)
    ax.text(0.01, 0.99, "90% Confidence interval = [{:.3f}, {:.3f}]".format(*ci), size=8,
            va='top', ha='left', transform=ax.transAxes,
            bbox=dict(boxstyle="round",
                        ec=(0.5, 0.5, 0.5),
                        fc=(0.9, 0.9, 0.9),
                        )
            )
    ax.set_ylabel('Count')


if __name__ == '__main__':
    plot()
Total running time of the script: (0 minutes 0.588 seconds)