Add velocity perturbation
Add velocity perturbation onto gll data format file
The program of sem_model_addpert.f90 provide functions to add velocity perturbation to points with Gaussian spatial filtering. The program read all GLL points and then calculate the distance between perturbation points and GLL points to determine amplitudes of the Gaussian filter.
\[g(d) = \exp{-\frac{d^2}{2\sigma^2}}\]
Where the \(d\) is this distance. \(\sigma\) is the Gaussian factor in meter.
The core algorithm is shown as
 do ipt=1,npts ! Number of perturbation points
  do ispec=1,nspec
    do k=1,NGLLZ
      do j=1,NGLLY
        do i=1,NGLLX
          iglob = ibool(i,j,k,ispec)
          ! calculate distance
          dist(ipt)=dsqrt((x(ipt)-dble(xstore(iglob)))**2 &
                     +(y(ipt)-dble(ystore(iglob)))**2 &
                     +(z(ipt)-dble(zstore(iglob)))**2)
          gaus=exp(-1*dist(ipt)*dist(ipt)/2/sigma/sigma)
          vstore_new(i,j,k,ispec)=vstore(i,j,k,ispec)*(1+pert*gaus)
          dlnvs_gaus(i,j,k,ispec)=pert*gaus
        enddo
      enddo
    enddo
  enddo
enddo
Compilation
Compile sem_model_addpert.f90 with mpif90.
mpif90 -O3 -traceback -o sem_model_addpert sem_model_addpert.f90 exit_mpi.f90 read_basin_topo_bathy_file.f90 utm_geo.f90
Run with mpirun
To add a 6% perturbation with
model_dir=model_2layers
topo_dir=OUTPUT_FILES/DATABASES_MPI
cat > gaus01.dat << eof
60000.0 0.0 -20000.0

eof
dvs=0.06
sigma=3000
mpirun -np 4 $prog gaus01.dat $topo_dir $model_dir vs $dvs $sigma
Virtualization of GLL data format
Convert binary file to npz
I revise code of auxiliaries/project_and_combine_vol_data_on_regular_grid.f90 for converting materials form the GLL format to npz format.
data_filename=vs
indir=model_pert/
outdir=output_vtk/

cat > fd_proj_grid.txt <<eof
0.0 -20000.0 -120000
1000 1000 800
121  41   151
eof

mpirun -np $NPROC ./bin/xproject_and_combine_vol_data_on_regular_grid $data_filename $indir $outdir
Note
The format of each line in fd_proj_grid.txt is
Starting Coordinates
Sampling of points
Number of points
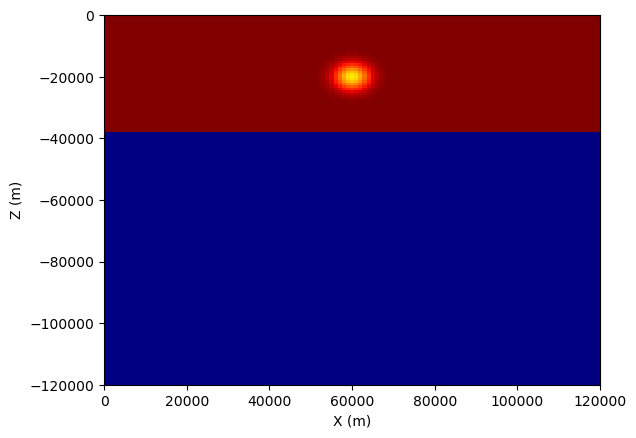
Slice and plotting
Now using matplotlib to plot cross sections
import numpy as np
import matplotlib.pyplot as plt

def plot(name='vs'):
    data = np.load('output_vtk/{}_projected.npz'.format(name))
    center_y = int((data['y'].size-1)/2)
    sec = data[name][:, center_y, :].T
    print(data['z'])
    plt.pcolormesh(data['x'], data['z'], sec, cmap='jet_r')
    plt.xlim([data['x'][0], data['x'][-1]])
    plt.ylim([data['z'][0], data['z'][-1]])
    plt.xlabel('X (m)')
    plt.ylabel('Z (m)')
    plt.savefig('{}_sec_y{:.2f}.png'.format(name, data['y'][center_y]), bbox_inches='tight')

if __name__ == '__main__':
    plot('vs')