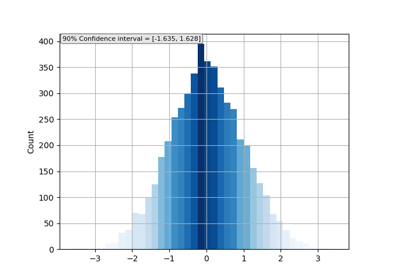
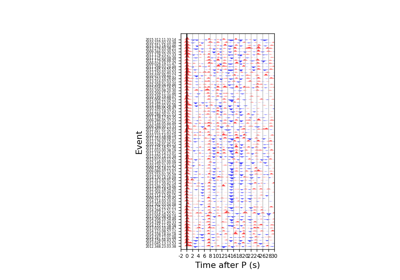
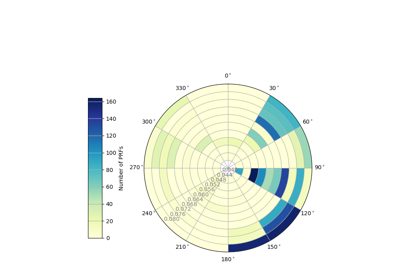
Matplotlib Gallery¶ This gallery contains examples of how to generate seismic images using Matplotlib. Colored histogram Colored histogram Receiver Functions order by back-azimuth Receiver Functions order by back-azimuth 2D bars for binned events 2D bars for binned events Gallery generated by Sphinx-Gallery