Note
Go to the end to download the full example code.
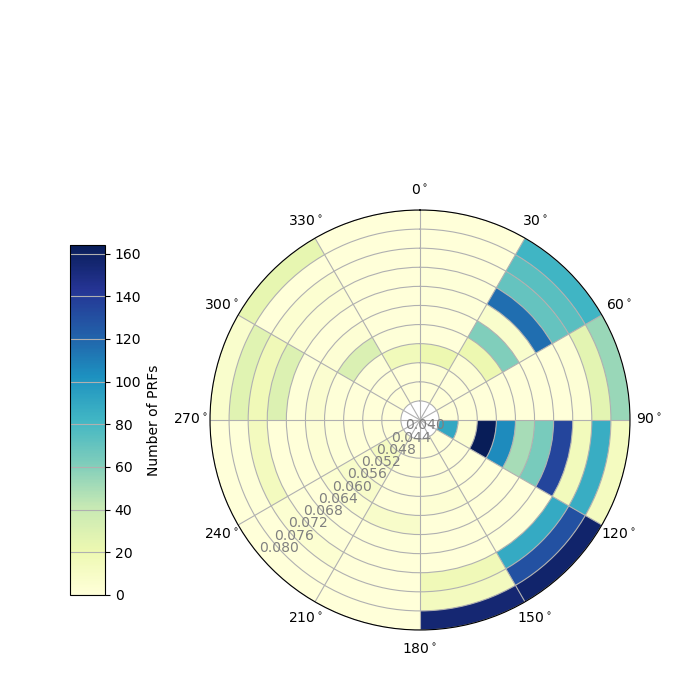
2D bars for binned events
This is an example of plotting event count with binned stacking by back-azimuth and ray-parameters.
/home/runner/work/docs.post/docs.post/source/examples/matplotlib/evts_stack.py:42: SyntaxWarning: invalid escape sequence '\c'
  ax.set_xticklabels(['{}$^\circ$'.format(v) for v in np.arange(0, 360, 30)])
import numpy as np
import matplotlib.pyplot as plt
from matplotlib.colorbar import ColorbarBase
from matplotlib.colors import Normalize
from obspy.imaging.cm import get_cmap

def plot(evts_file='data/binned_evts.txt'):
    evts_stack = np.loadtxt(evts_file)
    cmap = get_cmap('YlGnBu')
    dh = 0.004
    dww = 30
    rayp_bins = np.arange(0.04, 0.08+dh, dh).astype(float)
    baz_bins = np.arange(0., 360.+dww, dww).astype(float)+15
    N = baz_bins.size
    dw = np.mean(np.diff(np.linspace(0, 2*np.pi, N)))
    N -= 1
    N2 = rayp_bins.size
    N2 -= 1
    hist = np.zeros([N, N2])
    for i, evt in enumerate(evts_stack):
        idx_ba = np.where(baz_bins == evt[0])[0]
        idx_ra = np.where((rayp_bins > evt[1]-0.0005) & (rayp_bins < evt[1]+0.0005))[0]
        hist[idx_ba, idx_ra] = evt[2]
    fig = plt.figure(figsize=(7, 7))
    cax = fig.add_axes([0.1, 0.15, 0.05, 0.5])
    ax = fig.add_axes([0.30, 0.1, 0.6, 0.6], polar=True)
    ax.set_theta_direction(-1)
    ax.set_theta_zero_location("N")
    for i, row in enumerate(hist):
        bars = ax.bar(x=(i * dw) * np.ones(N2)+2*np.pi*15/360,
                      height=dh * np.ones(N2),
                      width=dw, bottom=dh * np.arange(N2)+0.04,
                      color=cmap(row / hist.max()))
    ax.set_xticks(np.arange(0, 2*np.pi, 2*np.pi*30/360))
    ax.set_xticklabels(['{}$^\circ$'.format(v) for v in np.arange(0, 360, 30)])
    ax.set_ylim(0.036, 0.08)
    ax.set_yticks(rayp_bins)
    [i.set_color('grey') for i in ax.get_yticklabels()]
    ax.set_rlabel_position(230)
    ColorbarBase(cax, cmap=cmap,
                 norm=Normalize(vmin=hist.min(), vmax=hist.max()))
    cax.set_ylabel('Number of PRFs')
    cax.grid(axis='y')
    plt.show()


if __name__ == '__main__':
    plot()
Total running time of the script: (0 minutes 0.270 seconds)